

Distance Time Velocity Time Graph: A “Distance-Time Velocity-Time Graph,” often referred to as a “velocity-time graph” or “speed-time graph,” is a graphical representation that illustrates how an object’s velocity or speed changes over time. Here’s how to understand and interpret such a graph:


Distance Time Velocity Time Graph
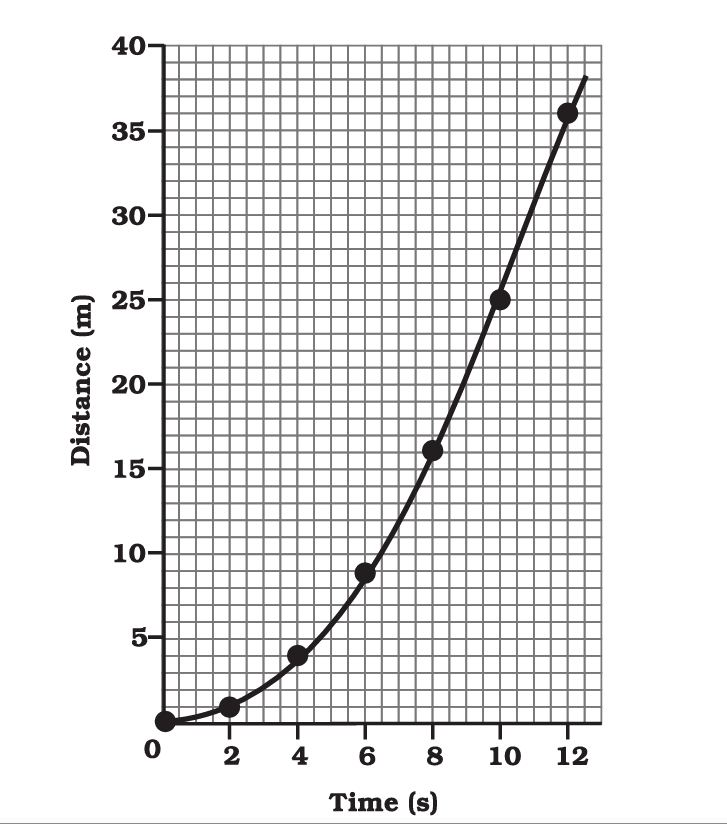
Distance-Time Graph:
- On the horizontal axis (x-axis), you’ll find time, typically measured in seconds (s).
- On the vertical axis (y-axis), you’ll find distance or displacement, typically measured in meters (m) or kilometers (km).
- A straight line on a distance-time graph represents constant velocity or speed. The slope of the line indicates the velocity.
- A horizontal line indicates that the object is at rest (not moving).
- An upward-sloping line indicates positive velocity (moving away from the starting point).
- A downward-sloping line indicates negative velocity (moving toward the starting point).
- Curved lines represent changing velocities or acceleration.

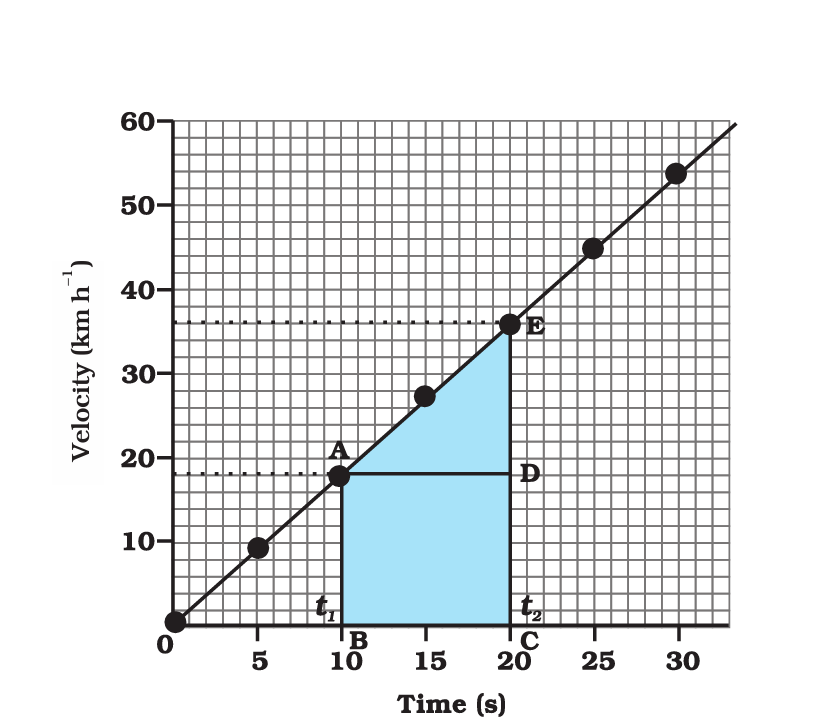
Velocity-Time Graph:
- On the horizontal axis (x-axis), you’ll find time, typically measured in seconds (s).
- On the vertical axis (y-axis), you’ll find velocity or speed, typically measured in meters per second (m/s) or kilometers per hour (km/h).
- A straight line on a velocity-time graph represents constant acceleration or deceleration.
- The slope of the line indicates acceleration (positive or negative) when the line is not horizontal.
- A horizontal line represents constant velocity (no acceleration).
- Areas under the curve represent displacement or distance traveled. The area between the graph and the time axis indicates the total distance covered.
- Points where the velocity-time graph crosses the time axis represent moments when the object is at rest (velocity = 0).

Interpreting the Graphs:
- On a distance-time graph, the steeper the slope, the greater the speed or velocity.
- On a velocity-time graph, the slope indicates acceleration. Positive slopes indicate acceleration in the positive direction, while negative slopes indicate acceleration in the negative direction.
- A horizontal line on a velocity-time graph implies constant speed.
- The area under a velocity-time graph curve represents the change in distance or displacement.
In summary, a distance-time graph shows how an object’s position changes with time, while a velocity-time graph reveals how an object’s velocity or speed changes with time.
Read More
- Average Speed And Average Velocity Class 9
- Differences Between Acceleration And Velocity
- Matter In Our Surroundings Class 9 Summary
- Class 9th Chapter 2 Science Question Answer of NCERT
- NCERT Physics Class 9 Chapter 1 Solutions PDF Download
Frequently Asked Question (FAQs) on Distance Time Velocity Time Graphs:
What is a distance-time graph, and how is it used?
A distance-time graph illustrates how an object’s position or distance changes over time. It’s used to visualize an object’s motion, calculate its speed, and understand whether it is moving, at rest, or changing its speed.
How do you interpret a straight line on a distance-time graph?
A straight line on a distance-time graph represents constant speed. The slope of the line indicates the speed, with a steeper slope representing a greater speed.
What does a horizontal line on a distance-time graph signify?
A horizontal line indicates that the object is at rest or not changing its position with time.
What is a velocity-time graph, and what does it show?
A velocity-time graph depicts how an object’s velocity (speed and direction) changes over time. It provides insights into an object’s acceleration, constant velocity, and moments of rest.
How is acceleration represented on a velocity-time graph?
Acceleration is represented by the slope of a line on a velocity-time graph. A positive slope indicates acceleration in the positive direction, while a negative slope represents acceleration in the negative direction.