

Median Formula Class 10th: Statistics encompasses the gathering, examination, interpretation, and representation of extensive sets of numerical data. Captain John Graunt of London earned recognition as the pioneer of vital statistics due to his significant contributions in studying the statistics of births and deaths.
Among the key concepts in statistics, the median holds a vital position. Serving as a measure of central tendency, the median represents the middle-most value within a dataset. In this article, we will explore methods for calculating the median for both grouped and ungrouped data.
NCERT Math Median Formula Class 10th

What is Median?
The median represents the middlemost value within a given set of data.
How to calculate Median Step by Step Process
Median Formula for ungrouped data:
1. Organize the provided values in ascending order.
2. Determine the total number of observations in the dataset, denoted as ‘n.’
3. If ‘n’ is an odd number, the median corresponds to the value of the [(n+1)/2]th observation.
4. If ‘n’ is an even number, calculate the median as the average of the (n/2)th and [(n/2)+1]th observations.
Median Formula for For grouped data:
- Step 1: Create a table with three columns – the first column is for the class interval, the second column for frequency (f), and the third column for cumulative frequency (cf).
- Step 2: Fill in the table by writing the class intervals and their corresponding frequencies.
- Step 3: Calculate the cumulative frequency by adding the frequency at each step in the third column (cf).
- Step 4: Find the sum of all frequencies (∑f); it should match the last number in the cumulative frequency column.
- Step 5: Calculate n/2 (where ‘n’ is the total number of observations). Identify the class whose cumulative frequency is greater than or closest to n/2; this class is known as the median class.
- Step 6: Now, apply the formula:
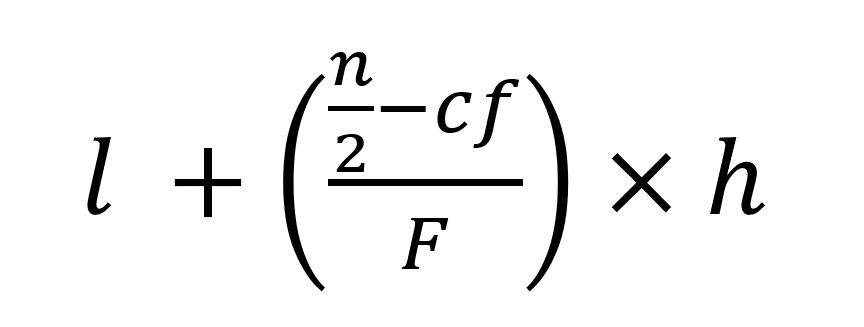

l = lower limit of the median class
n = number of observations
cf denotes the cumulative frequency of the class preceding the median class
f = frequency of the median class
h = class size (assuming classes are of equal size)
Median Formula Class 10th: Solved Example
Example 1: What is the median age of the students in a classroom with the following ages: 12, 14, 15, 16, 17, 18?
Solution:
To find the median age of the students in the classroom, follow these steps:
Step 1: Arrange the ages in ascending order:
12, 14, 15, 16, 17, 18
Step 2: Determine the total number of ages (n) in the dataset. In this case, n = 6.
Step 3: Since the number of ages (n) is even, we use the following formula to find the median:
Median = (n/2)th observation + [(n/2)+1]th observation / 2
Step 4: Substitute the values and calculate the median:
- Median = (6/2)th observation + [(6/2)+1]th observation / 2
- Median = 3rd observation + 4th observation / 2
- Median = (15 + 16) / 2
- Median = 31 / 2
- Median = 15.5
Therefore, the median age of the students in the classroom is 15.5 years.
Example 2: In a coding competition conducted at IIT, there were 50 participants. The median time taken by the participants to solve the coding problems was found to be 90 minutes. Now, you are given that 30 participants took more time than the median to solve the problems.
Can you calculate the maximum possible time (in minutes) taken by any participant to solve the problems in this coding competition?
Solution:
- Total number of participants (n) = 50
- Median time taken by participants = 90 minutes
- Number of participants taking more time than the median = 30
Since the median represents the middlemost value in the dataset, we can infer that there are 25 participants who took less time than the median (as there are 50 participants in total).
Now, we have the following information:
- Number of participants taking less time than the median = 25
- Number of participants taking more time than the median = 30
To find the maximum possible time taken by any participant, we can focus on the participants who took more time than the median. Since we don’t have the exact values of these 30 participants, we can only find the upper bound for the maximum time.
Since there are 30 participants who took more time than the median, the worst-case scenario for the maximum time taken by any participant would be if all these 30 participants took the exact same time, which is greater than the median.
Thus, the maximum possible time taken by any participant can be assumed to be the same as the median (90 minutes) or any value greater than 90 minutes.
In conclusion, the maximum possible time taken by any participant in the coding competition can be at least 90 minutes, but we cannot determine an exact value without more information about the individual times of those 30 participants.
Properties of Median in Statistics
The properties of the median in statistics can be summarized as follows:
- Independence: The median is not influenced by all the data values in a dataset. It is solely determined by its position within the sorted data.
- Positional Value: The median’s value is fixed by its position and does not directly represent any individual data point.
- Central Measure: The median’s distance to other values is smaller compared to any other point, making it a robust central measure.
- Uniqueness: Every dataset has a unique median, resulting in a single value that represents the middle observation.
- Non-Alterability: The median cannot be manipulated algebraically or combined through weighting; it retains its original position.
- Stability in Grouping: When data is grouped, the median remains stable and consistent.
- Limitation to Numeric Data: The median is not applicable to qualitative data and requires data to be grouped and ordered for calculation.
- Applicability to Scales: The median can be determined for datasets measured on ratio, interval, and ordinal scales.
- Robustness to Outliers: Outliers and skewed data have less impact on the median, making it a more resistant measure than the mean.
- Skewed Data Preference: In skewed distributions, the median is considered a better measure than the mean for representing the central tendency.
Read More
- Trigonometry Class 10 formulas List for NCERT Maths Students
- Sample Question Paper for Class 10 CBSE Maths With Solutions
- RD Sharma Class 10 Book Pdf Free Download Without Solutions
Frequently Asked Questions on Median Formula Class 10th
Q 1: How to find the median of ungrouped data?
To find the median of ungrouped data, follow these steps:
- Arrange the data in ascending order (from smallest to largest).
- Determine the total number of observations (n) in the dataset.
- If the number of observations (n) is odd, the median is the middlemost value. For example, if there are 9 data points, the 5th observation is the median.
- If the number of observations (n) is even, the median is the average of the two middlemost values. For example, if there are 10 data points, the 5th and 6th observations are the middlemost, and the median is the average of these two values.
Q 2: Which are the measures of central tendency?
The three main measures of central tendency are:
- Mean: The mean is the most commonly used measure of central tendency. It is calculated by summing up all the values in the dataset and then dividing by the total number of values (n).Mean = (Sum of all values) / n
- Median: The median is the middlemost value in an ordered dataset. It separates the higher half of the data from the lower half. To find the median, the data must be arranged in ascending or descending order, and if the number of observations (n) is odd, the median is the middle value; if n is even, it is the average of the two middle values.
- Mode: The mode is the value that appears most frequently in the dataset. It is possible for a dataset to have one mode (unimodal), two modes (bimodal), or more (multimodal), or it may have no mode if all values occur with the same frequency.
Q 3: What is the symbol of median?
The mean is commonly denoted by M, while the median is represented by Mdn. When referring to standard deviation, the symbol s (the Greek lower-case letter “sigma”) is typically used to represent the population standard deviation. On the other hand, s is employed to signify the standard deviation of a sample of scores.